True Detects
Front-End for an Analytical Trading Service
concept:
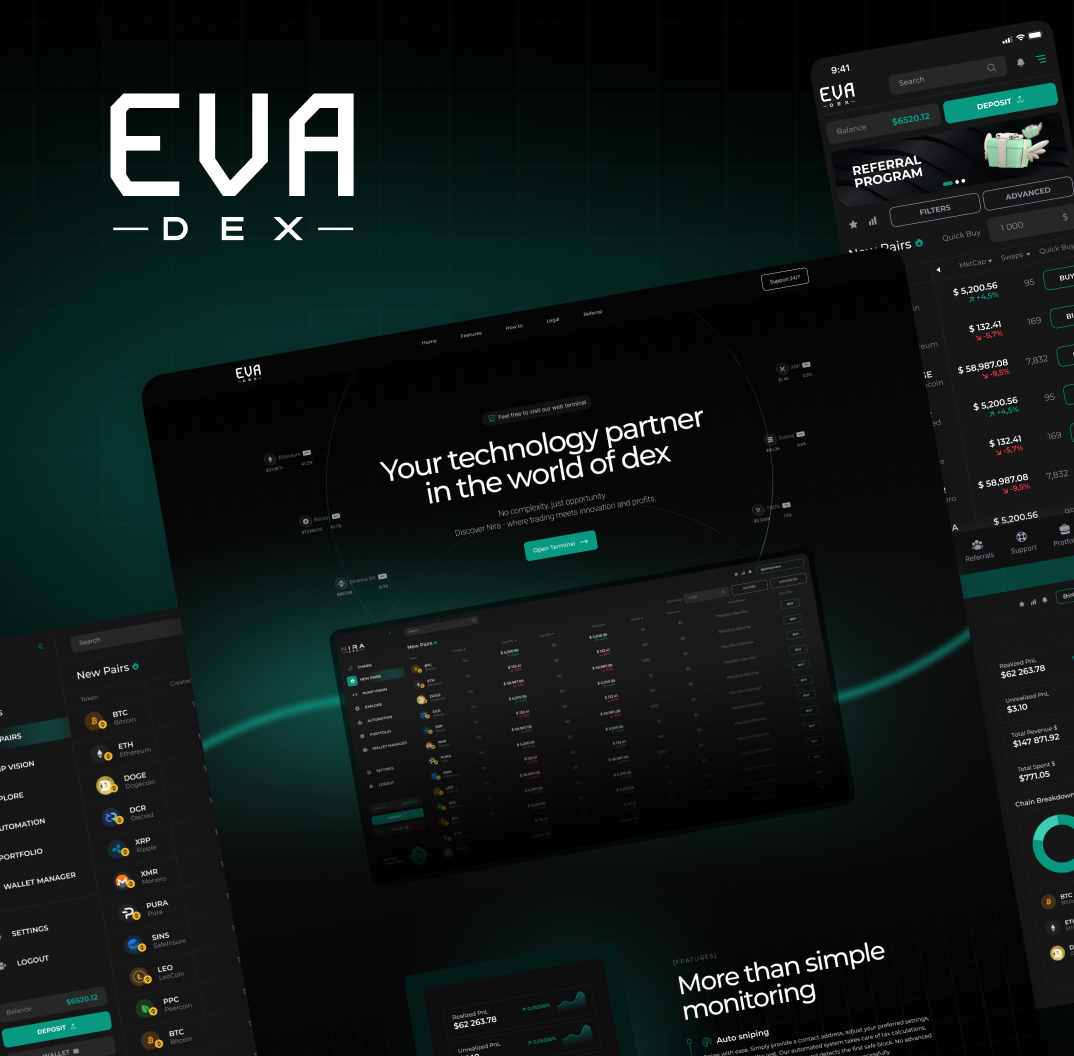
The platform is designed to display financial data using charts, including candlestick charts, scatter plots, and oscillators. The charts must be visually clear, support high performance, and allow customization.
Objective:
The main task is to move away from the limitations of current solutions, optimize data loading, and implement custom graphical components.

Industries:
- Financial Analytics and Data Visualization Technologies
services
- Development of a user interface and charting system for a project focused on analytical data visualization. Special attention was given to optimization and flexibility of graphical components.
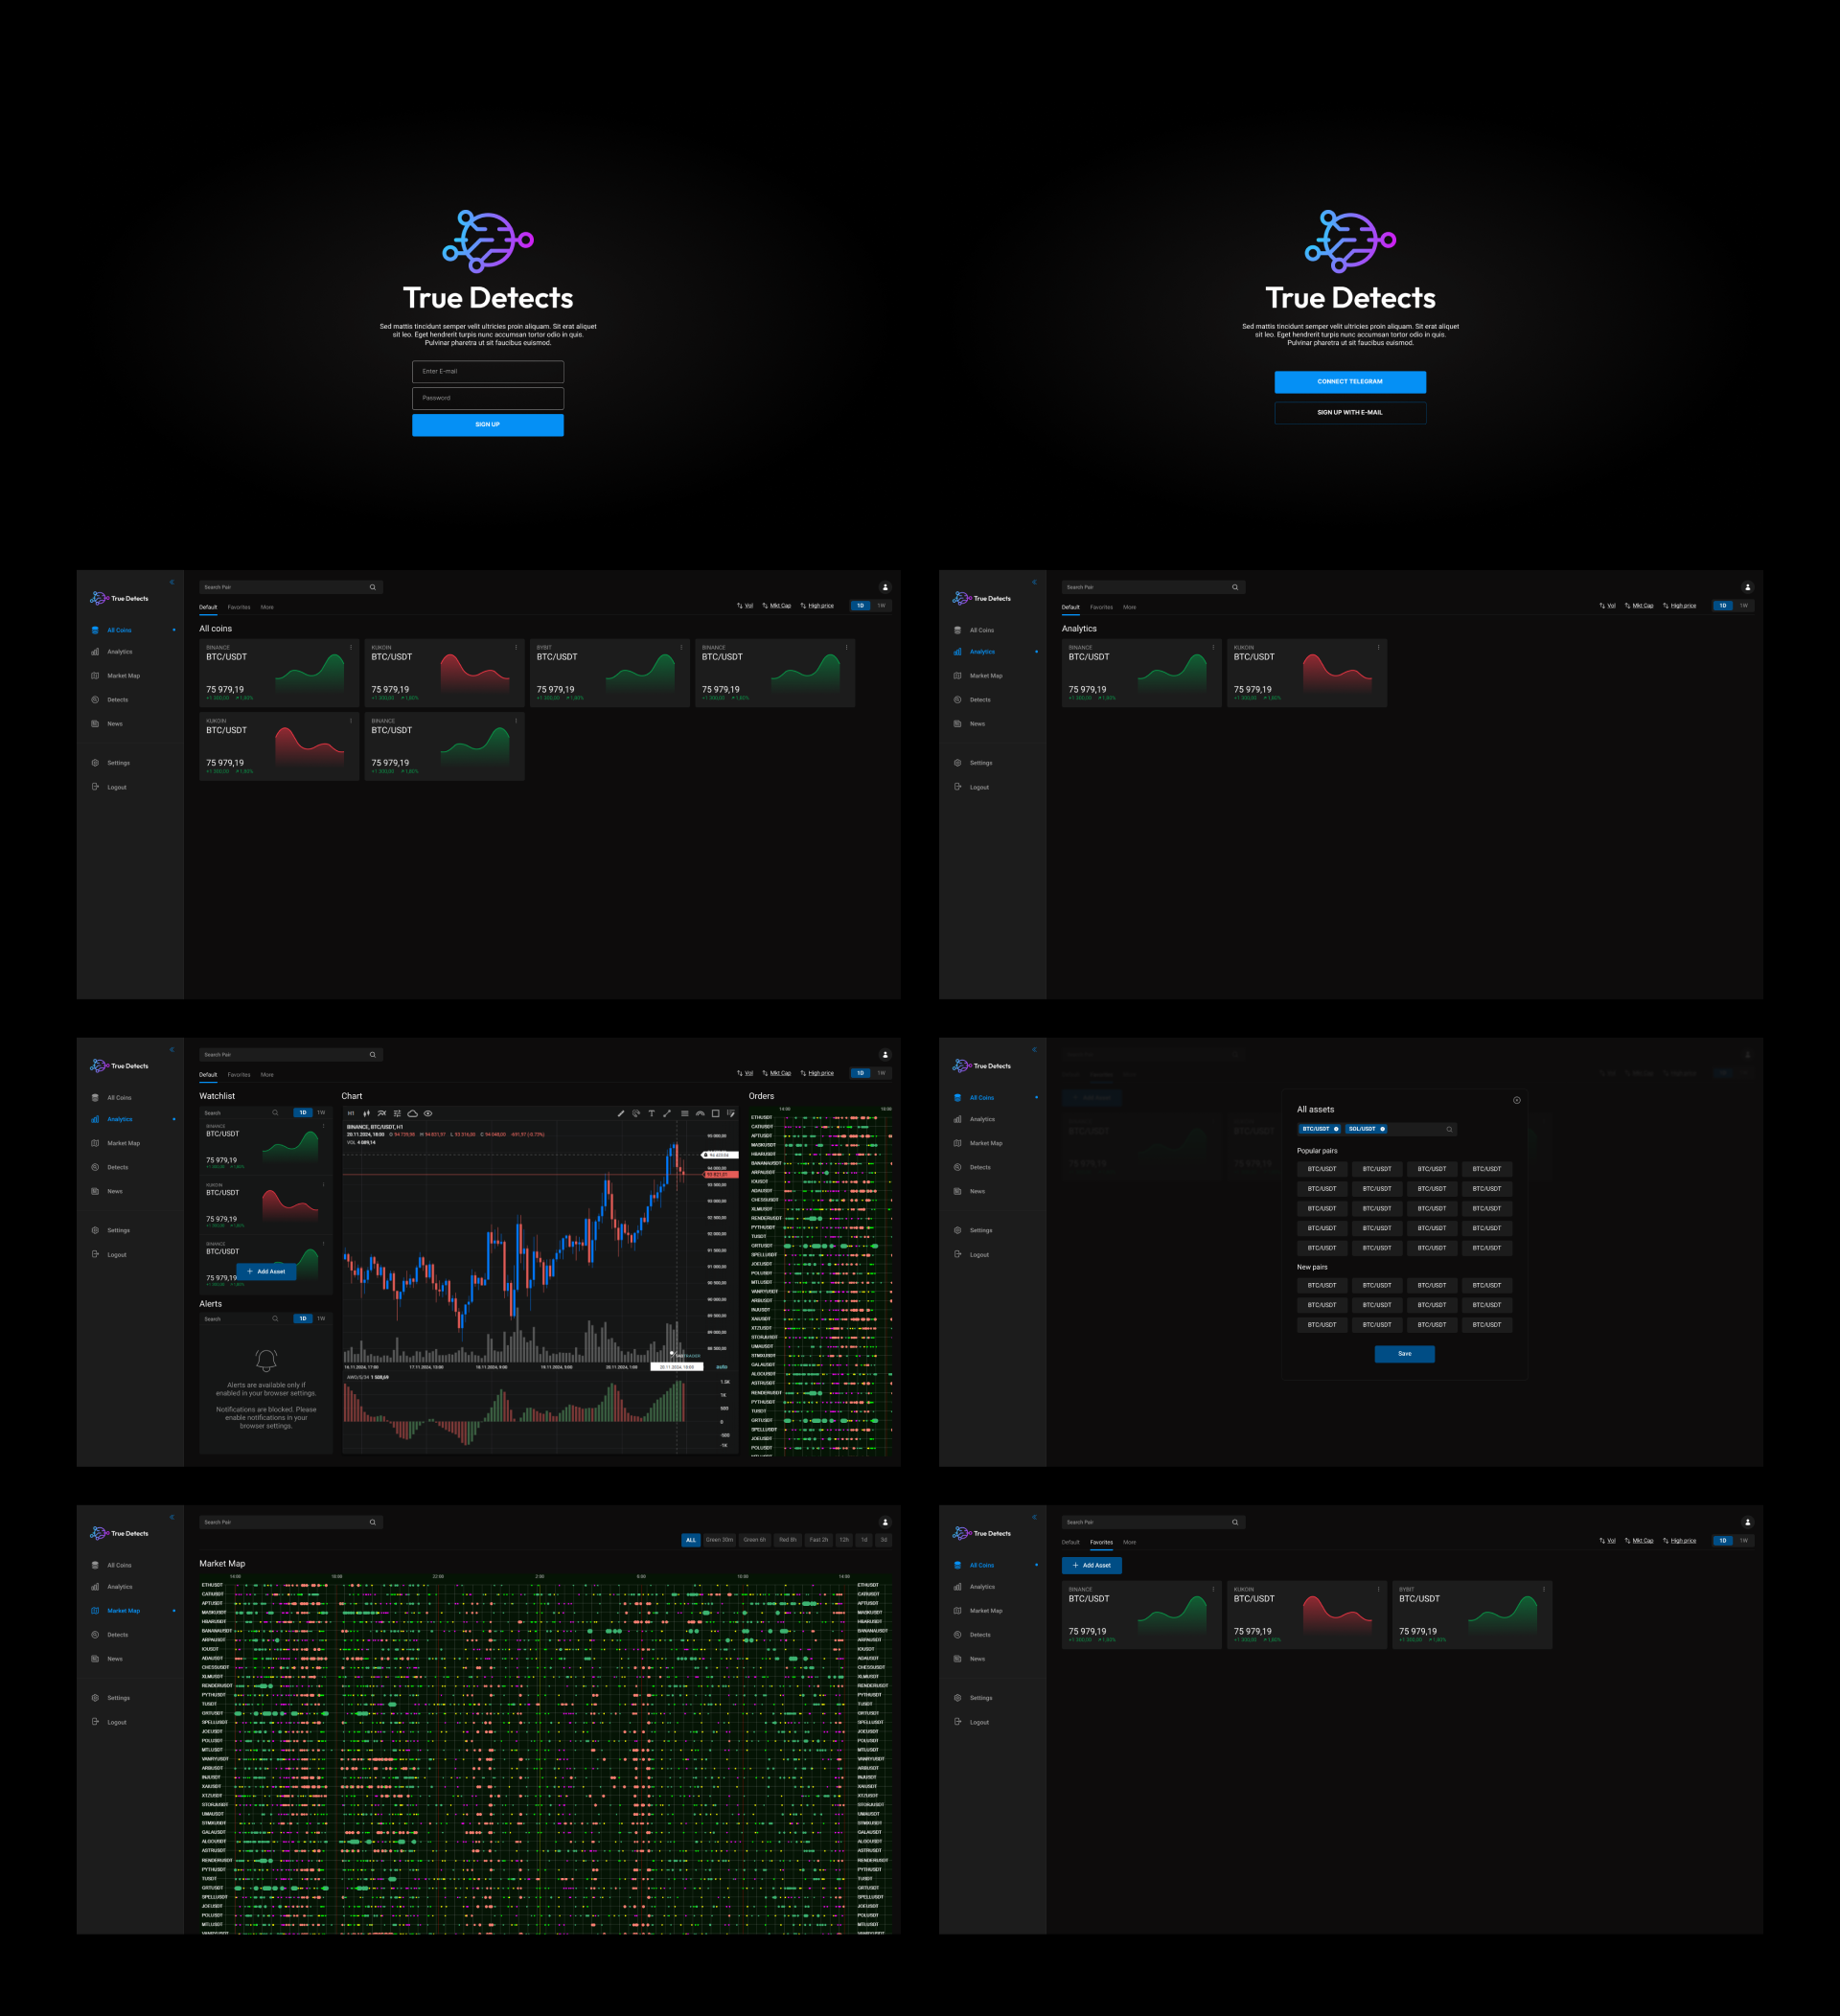
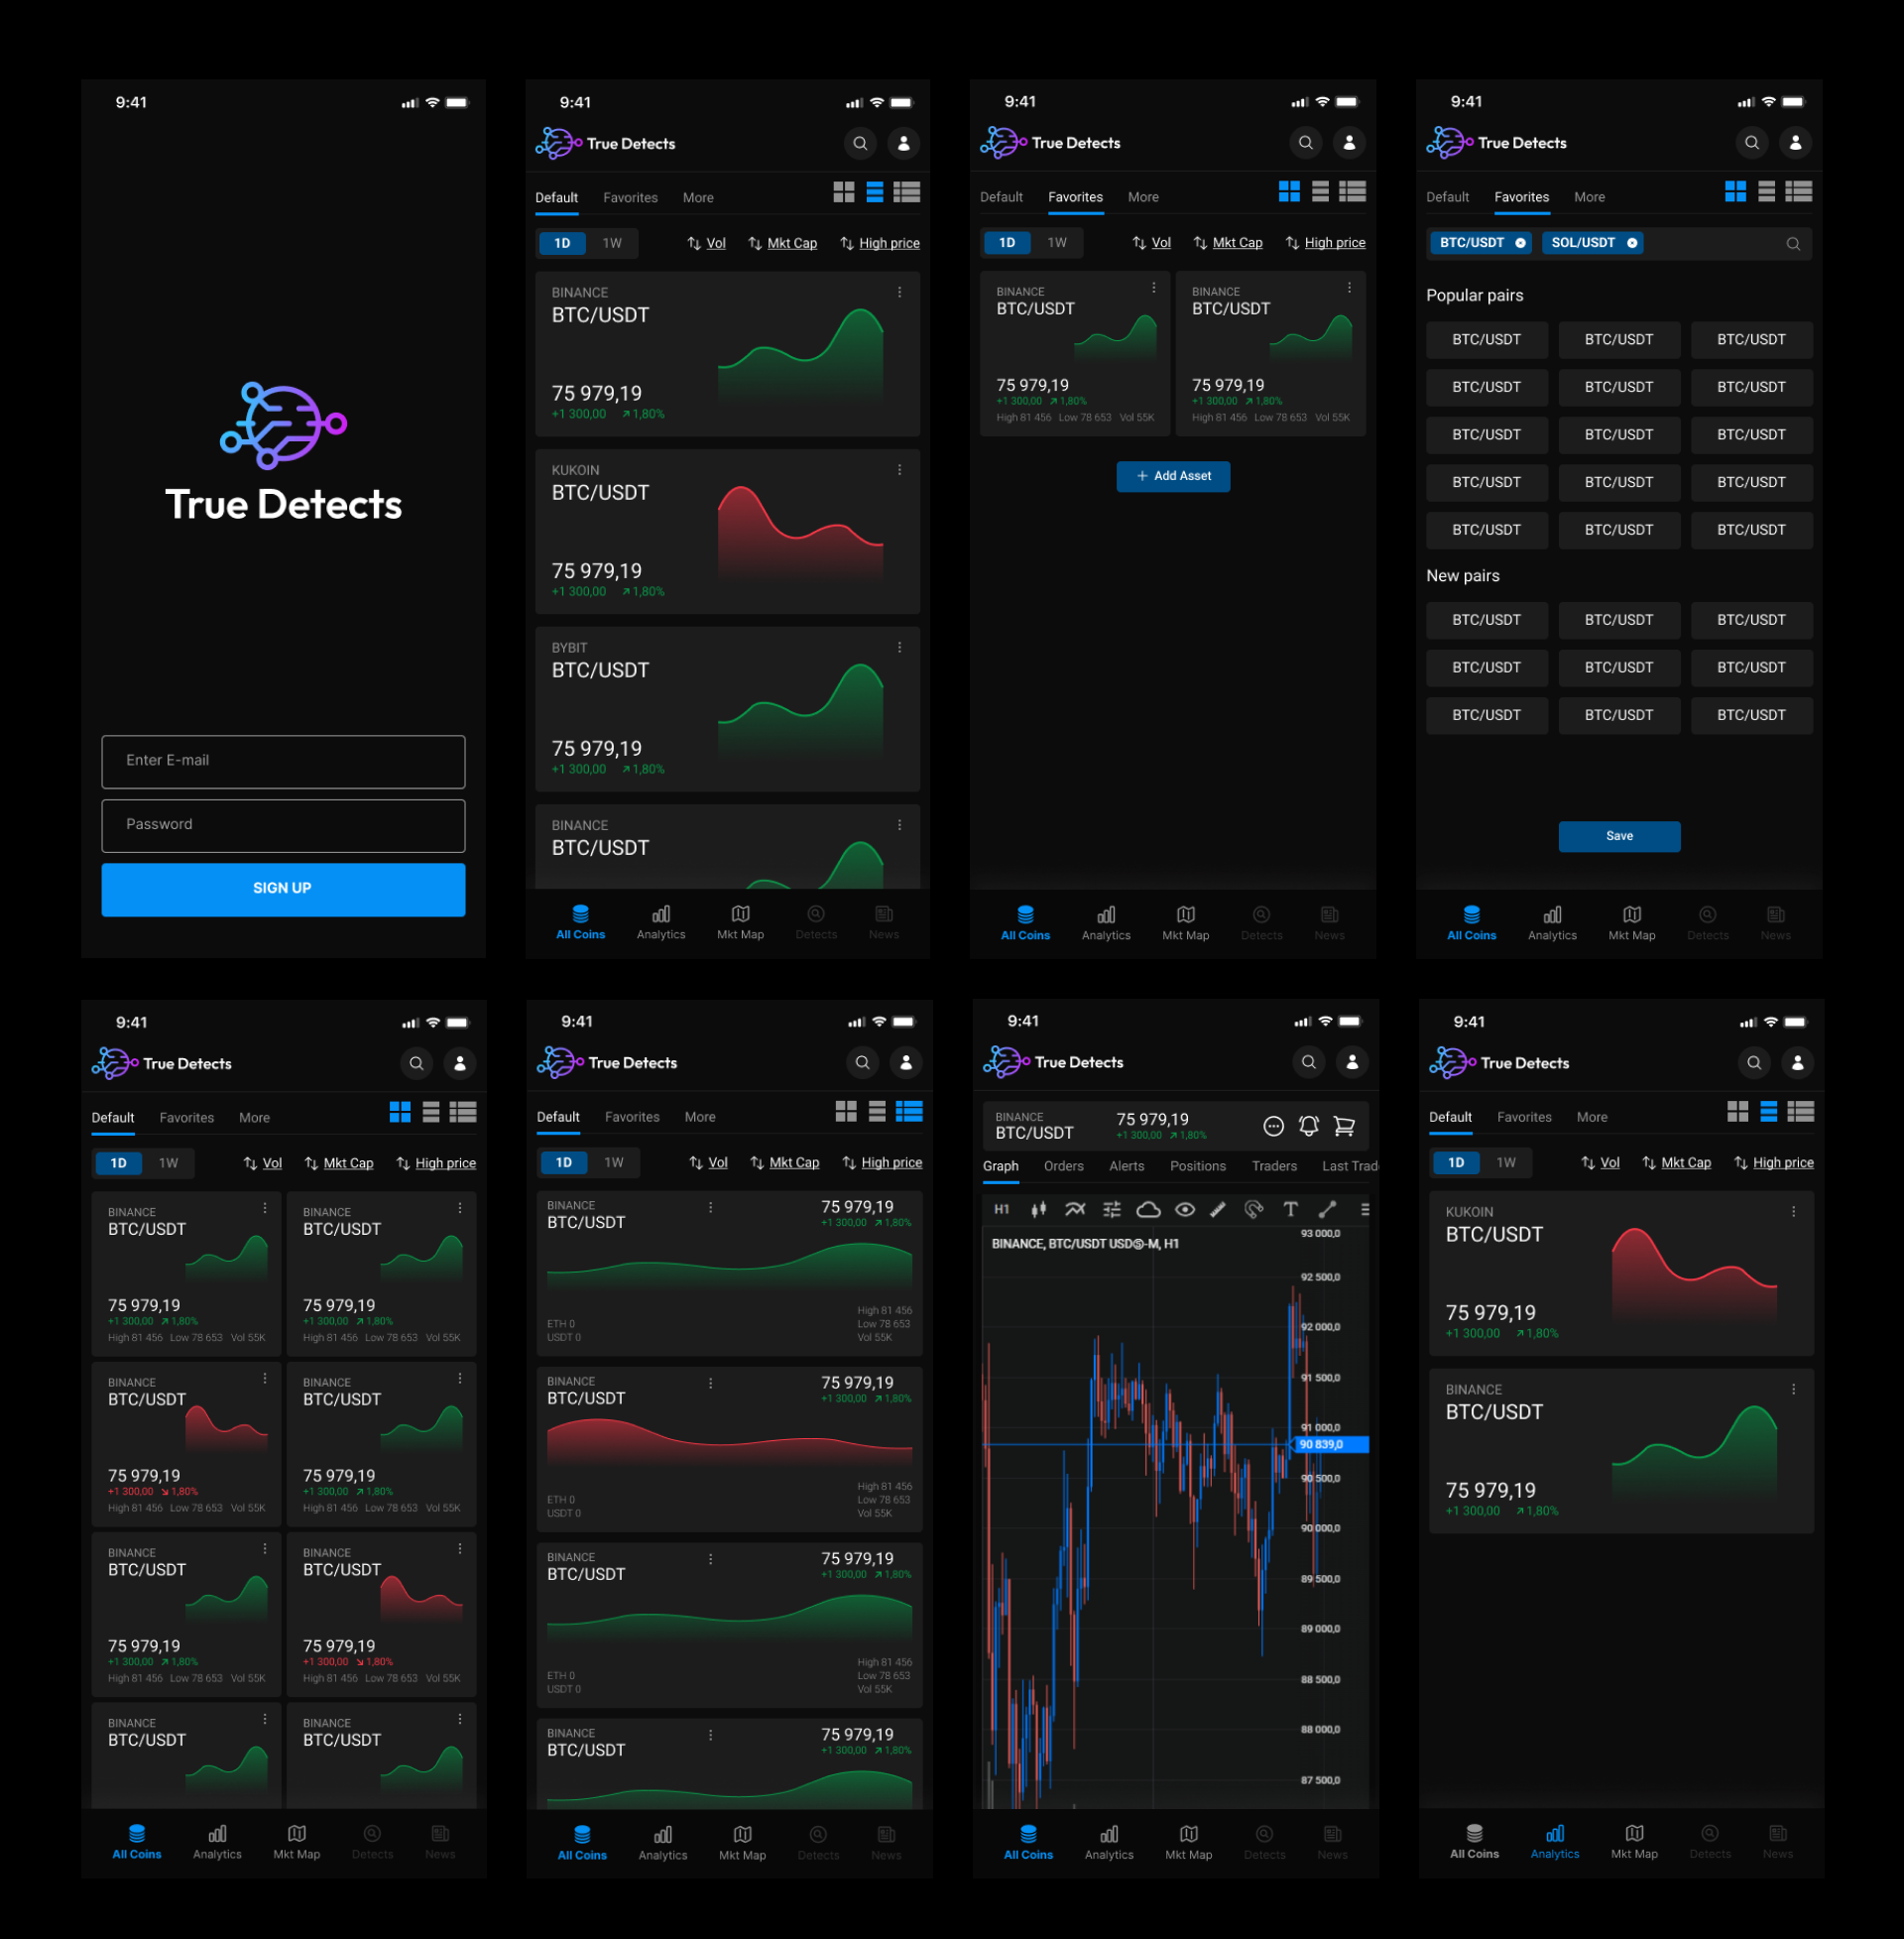
Done
- Login and registration screen.
- Pair catalog with price cards, 24h change, and mini charts.
- Default, Favorites, and More tabs with favorites management.
- Search and modal for adding an asset.
- Filters by volume, market cap, price, and timeframe.
- List of popular and new pairs with quick save.
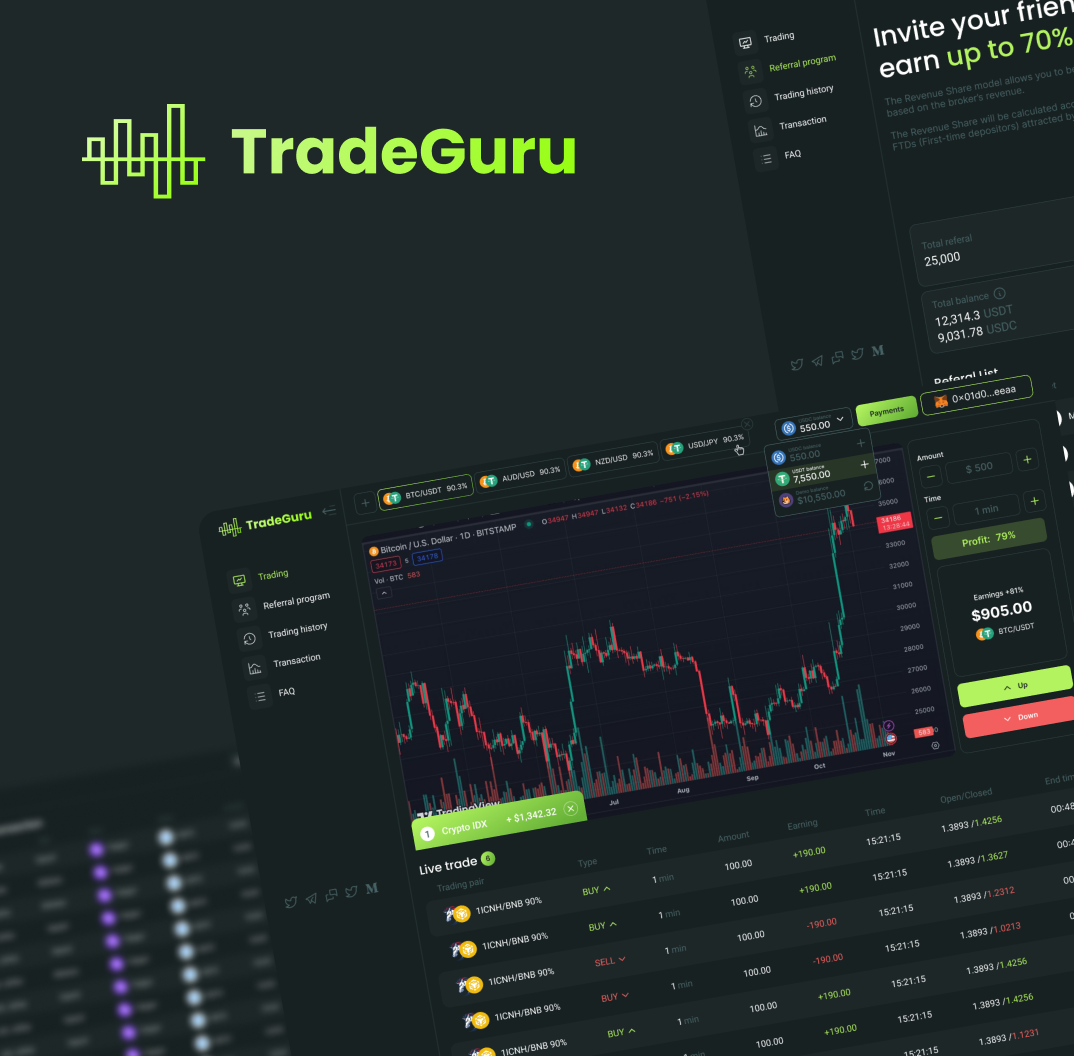
- Pair details with an interactive candlestick chart.
- Indicator overlays and timeframe selection.
- Orders, Alerts, Positions, and Last Trade tabs.
- Live trade feed and order book.
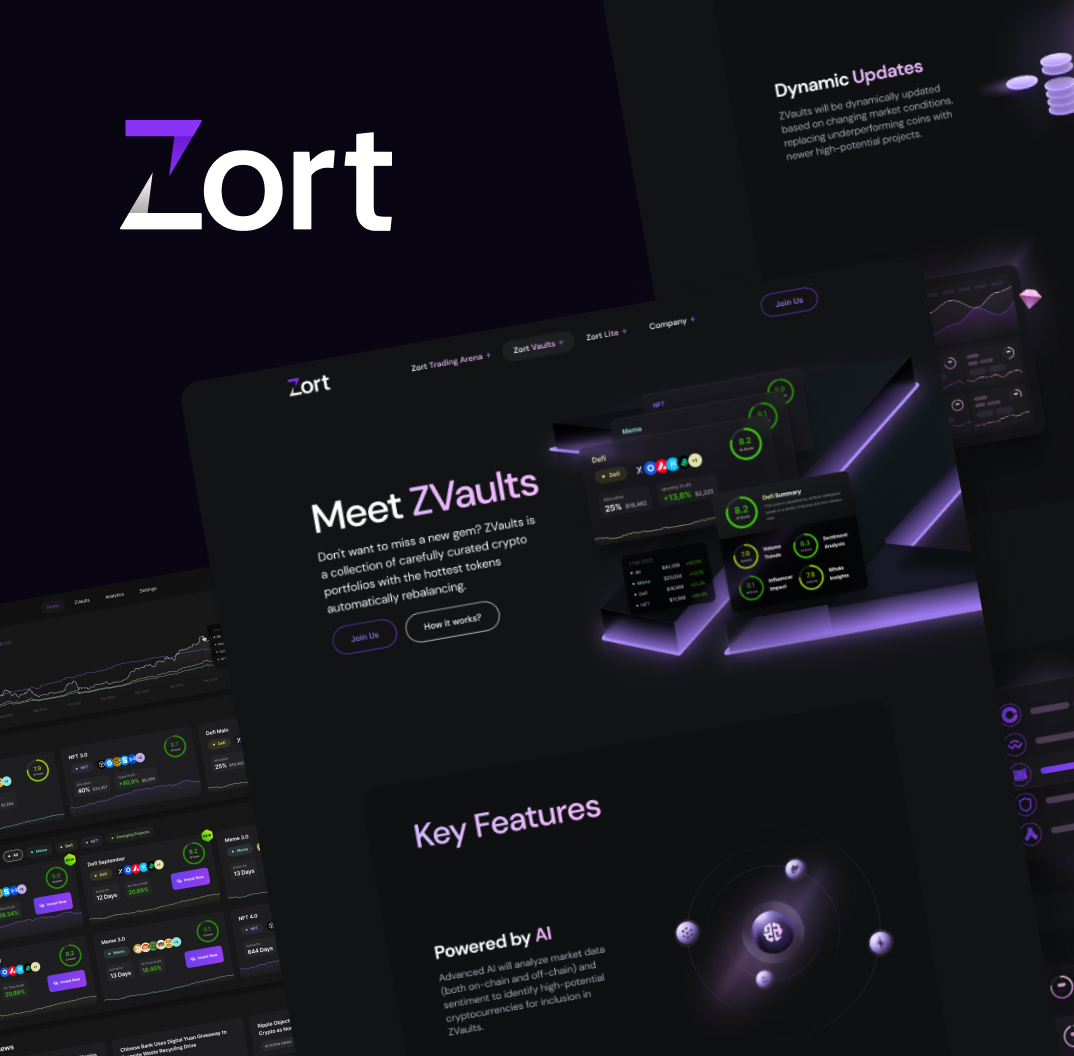
- Analytics and market heatmap with a signal scanner.
- All coins screen with sorting and filters.
- Synchronized favorites across web and mobile.
- Real-time mode for quotes and charts.
- Dark theme and compact asset cards.
- Profile settings and general app parameters.
Team